EKS using Terraform & setup Prometheus and Grafana

I am a dedicated full stack engineer and DevOps Engineer with a solid foundation in both front-end and back-end along with Cloud and DevOps.
Github Repo :- https://github.com/SahadevDahit/EKS-using-Terraform
Table of Contents
Introduction
Setup Terraform
Create EKS
Setup Master Node
Setup Prometheus
Setup Grafana
1) Introduction
-> Terraform: Terraform is an open-source infrastructure as code (IaC) tool used for building, changing, and versioning infrastructure safely and efficiently. It enables users to define and provision infrastructure resources such as virtual machines, networks, storage, and more using a declarative configuration language.
-> EKS Cluster: Amazon Elastic Kubernetes Service (EKS) is a managed Kubernetes service provided by AWS. It allows users to deploy, manage, and scale containerized applications using Kubernetes on AWS infrastructure. EKS clusters provide features such as automated Kubernetes upgrades, integrated AWS IAM authentication, and seamless integration with other AWS services.
-> AWS CLI: AWS Command Line Interface (CLI) is a unified tool that provides commands for interacting with various AWS services from the command line. It enables users to manage AWS resources, configure AWS settings, and automate tasks using scripts or command-line interfaces.
-> Kubectl: Kubectl is a command-line tool used for interacting with Kubernetes clusters. It allows users to deploy and manage applications, inspect cluster resources, and troubleshoot issues within Kubernetes environments. Kubectl provides a wide range of commands for managing Kubernetes clusters, nodes, pods, services, and more.
-> Prometheus: Prometheus is an open-source monitoring and alerting toolkit designed for monitoring containerized and cloud-native applications. It collects metrics from various sources, stores them in a time-series database, and enables querying and visualization of metrics data. Prometheus is widely used for monitoring Kubernetes clusters and applications deployed on them.
-> Grafana: Grafana is an open-source analytics and visualization platform used for creating dashboards and graphs to monitor and analyze time-series data. It integrates with various data sources, including Prometheus, to visualize metrics collected from applications, servers, and other sources. Grafana provides interactive and customizable dashboards for monitoring infrastructure and applications effectively.
-> Helm: Helm is a package manager for Kubernetes that streamlines the process of installing, upgrading, and managing applications on Kubernetes clusters. It uses charts, which are packages containing pre-configured Kubernetes resources, to simplify the deployment and management of complex applications.
VPC:
- A virtual network you create in AWS to isolate your resources.
Public Subnet:
- A subnet within a VPC where instances can have public IP addresses and access the internet directly.
Private Subnet:
- A subnet within a VPC where instances cannot have public IP addresses by default. They are typically used for resources that don't need direct internet access but can communicate with the internet through a NAT Gateway (optional).
NAT Gateway (Optional):
- A service that allows instances in private subnets to access the internet without directly exposing them publicly. It translates private IP addresses to a public IP for outbound traffic.
Internet Gateway:
- A gateway that allows resources in your VPC to access the internet.
Route Table:
- A table that defines how traffic is routed within your VPC. You can have separate route tables for public and private subnets to control traffic flow.
WorkFlow
step 1) Using Terraform, we create the vpc, public subnet, internet gateway. And Then EKS cluster inside the public subnet of the vpc.
step 2) Then we install the helm and with the helm package manager we install the prometheus and the grafana.
2) Setup Terraform
Go to the download link
Download according to your operating system
If you are using the Windows version, download the zip file and extract.
Then move the extracted folder to the c drive inside program files.
Then copy the path of the folder and add it to the system enviroment variables.

Then we also need to install the aws cli, For this
Go to the given link and download according to your operating system
https://docs.aws.amazon.com/cli/latest/userguide/getting-started-install.html
then open command prompt
After that, create the new IAM user with the administration permission and generate the access key


Then open command prompt and type aws configure and provide the necessay secret key and access key id

terraform init
terraform validate
terraform plan
terraform apply

terraform destroy
# if you are not able to delete vpc subnet then first delete loadbalancer
# if error arise
3) Create EKS


4) Setup Master Node
Setup the awscli
By default awscli is installed as well if you want to install new version
curl "https://awscli.amazonaws.com/awscli-exe-linux-x86_64.zip" -o "awscliv2.zip"
unzip awscliv2.zip
sudo ./aws/install
For more :- https://docs.aws.amazon.com/cli/latest/userguide/getting-started-install.html
Then add your credentials here

Setup the Kubectl
curl -O https://s3.us-west-2.amazonaws.com/amazon-eks/1.29.0/2024-01-04/bin/linux/amd64/kubectl
curl -O https://s3.us-west-2.amazonaws.com/amazon-eks/1.29.0/2024-01-04/bin/linux/amd64/kubectl.sha256
sha256sum -c kubectl.sha256
openssl sha1 -sha256 kubectl
chmod +x ./kubectl
mkdir -p $HOME/bin && cp ./kubectl $HOME/bin/kubectl && export PATH=$HOME/bin:$PATH
echo 'export PATH=$HOME/bin:$PATH' >> ~/.bashrc
kubectl version --client
# here dahit-eks is my cluster name, use your own cluster name
aws eks --region ap-southeast-1 describe-cluster --name dahit-eks --query cluster.status
aws eks --region ap-southeast-1 update-kubeconfig --name dahit-eks
kubectl get nodes
For more:- https://docs.aws.amazon.com/eks/latest/userguide/install-kubectl.html

Setup the helm
$ curl -fsSL -o get_helm.sh https://raw.githubusercontent.com/helm/helm/main/scripts/get-helm-3
$ chmod 700 get_helm.sh
$ ./get_helm.sh
5) Setup Prometheus
kubectl create namespace prometheus
helm install stable prometheus-community/kube-prometheus-stack -n prometheus
kubectl edit svc stable-kube-prometheus-sta-prometheus -n prometheus
# change ClusterIP into LoadBalancer

Then copy the external adderess:9090 into browser tab

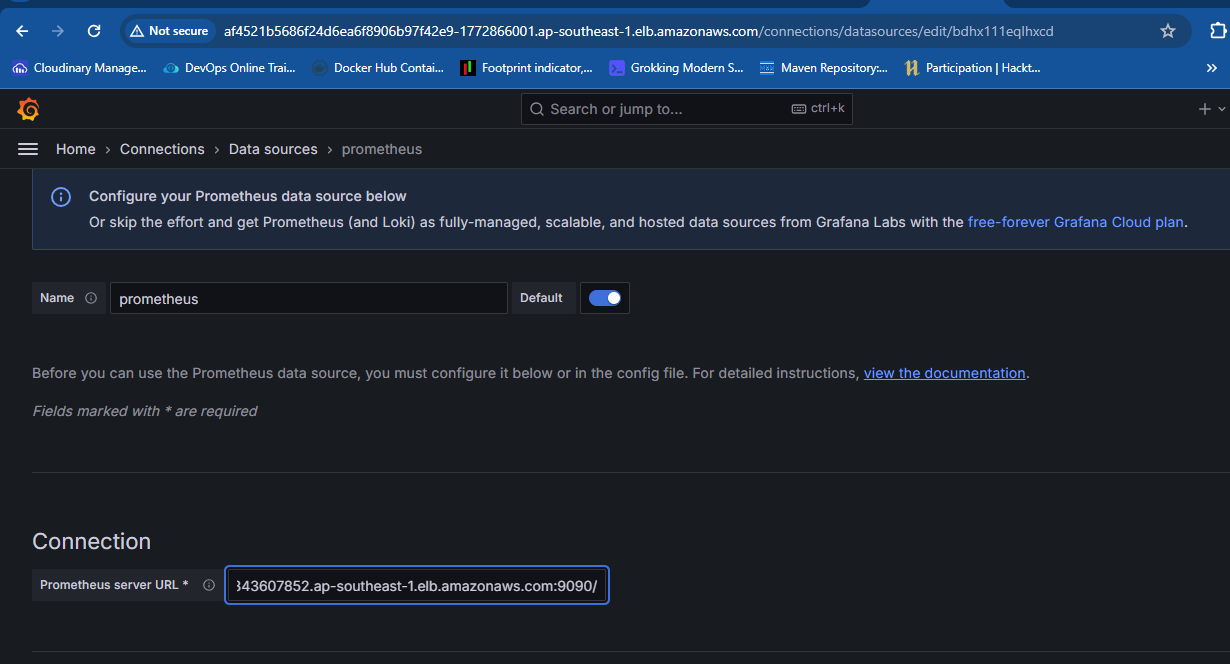
6) Setup Grafana
For installing the Grafana on Kubernetes, Use “helm install” command
helm repo add grafana https://grafana.github.io/helm-charts
helm repo update
helm install grafana grafana/grafana
kubectl get service
kubectl edit service grafana
# Change ClusterIP into LoadBalancer

Default username is admin
and to get the admin password
kubectl get secret --namespace default grafana -o jsonpath="{.data.admin-password}" | base64 --decode

Add the prometheus using 3662 and the ip of the prometheus server


In this way we create the EKS cluster using the terraform and monitor the eks cluster using the prometheus and the grafana
Thanks for reading....................................


